Mean & Standard Deviation
Descriptive statistics summarize data. To aid in comprehension, we can reorganize scores into lists. For example, we might put test scores in order, so that we can quickly see the lowest and highest scores in a group (this is called an ordinal variable, by the way. You can learn more about scales of measure here). After arranging data, we can determine frequencies, which are the basis of such descriptive measures as mean, median, mode, range, and standard deviation. Let’s walk through an example using test scores:
|
Student |
Score |
Score |
Score |
Frequency |
||
|
1 |
100 |
←1. As you can see, these scores are not in a user-friendly, interpretable format.
2. The first thing to do is order them.→ |
100 |
←3. Now you’ve got an ordered list that much easier to interpret at first glance.
4. You can go a step further and put like numbers together.→ |
100 |
4 |
|
2 |
78 |
100 |
97 |
2 |
||
|
3 |
97 |
100 |
93 |
1 |
||
|
4 |
97 |
100 |
88 |
1 |
||
|
5 |
78 |
97 |
87 |
1 |
||
|
6 |
88 |
97 |
86 |
1 |
||
|
7 |
87 |
93 |
78 |
2 |
||
|
8 |
100 |
88 |
↑ 5. This is called a Frequency Distribution. |
|||
|
9 |
86 |
87 |
||||
|
10 |
93 |
86 |
||||
|
11 |
95 |
78 |
||||
|
12 |
92 |
78 |
||||
Now, we can take those same scores and get some more useful information. Recall that Mean is arithmetic average of the scores, calculated by adding all the scores and dividing by the total number of scores. Excel will perform this function for you using the command =AVERAGE(Number:Number).
Now we know the average score, but maybe knowing the range would help. Recall that Range is the difference between the highest and lowest scores in a distribution, calculated by taking the lowest score from the highest. You can calculate this one by simple subtraction.
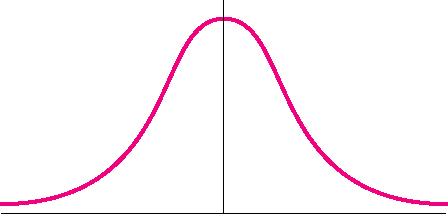
Understanding range may lead you to wonder how most students scored. In other words, you know what they scored, but maybe you want to know about where the majority of student scores fell – in other words, the variance of scores. Standard Deviation introduces two important things, The Normal Curve (shown below) and the 68/95/99.7 Rule. We’ll return to the rule soon.

The Normal Curve tells us that numerical data will be distributed in a pattern around an average (the center line).
Standard deviation is considered the most useful index of variability. It is a single number that tells us the variability, or spread, of a distribution (group of scores). Standard Deviation is calculated by:
Step 1. Determine the mean.
Step 2. Take the mean from the score.
Step 3. Square that number.
Step 4. Take the square root of the total of squared scores.
Excel will perform this function for you using the command =STDEV(Number:Number).
|
Student |
Score |
Standard Deviation |
|
|
1 |
100 |
1. Click on an empty cell and type in the formula for Standard Deviation.→
2. The formula returns the number, in this case, 8.399134, which we round to 8.40. |
|
|
2 |
78 |
|
|
|
3 |
97 |
|
|
|
4 |
97 |
||
|
5 |
78 |
=STDEV(A2:A13) | |
|
6 |
88 |
|
|
|
7 |
87 |
|
|
|
8 |
100 |
|
|
|
9 |
86 |
|
|
|
10 |
93 |
|
|
|
11 |
95 |
|
|
|
12 |
92 |
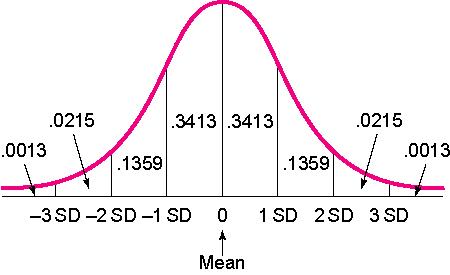
That number, 8.40, is 1 unit of standard deviation. The 68/95/99.7 Rule tells us that standard deviations can be converted to percentages, so that:
- 68% of scores fall within 1 SD of the mean.
- 95% of all scores fall within 2 SD of the mean.
- 99.7% of all scores fall within 3 SD of the mean.
For the visual learners, you can put those percentages directly into the standard curve:

Since 1 SD in our example is 8.40, and we know that the mean is 92, we can be sure that 68% of the scores on this test fall between 83.6 and 100.4. To get this range, I simply added 1 SD (8.40) to the mean (92), and took 1 SD away from the mean. Sometimes you see SD referred to as +/- in a journal article, which is indicating the same thing. Note: Quick thinkers will notice that since 50% of the sample is below the mean (to the left of 0 on the curve), you can add percentages. In other words, 84.13% of the scores fall 1SD above the mean. To get that number, I took the percentages between -3 SD and 0 on the left, (which equal 50), then added the percentage from 0 to 1 SD on the right (which is .3413).